Behavior Analytics — AI Customer Insights
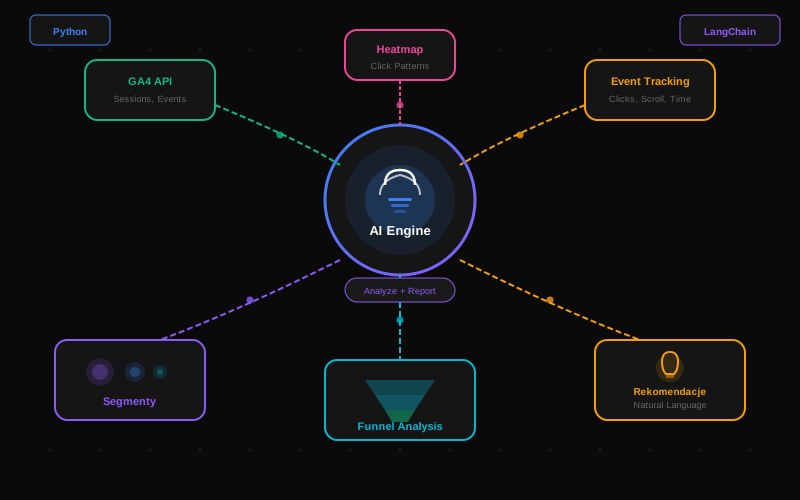
Analytics platform using AI to analyze user behavior on websites. Automatically identifies patterns, segments users and generates business recommendations. Data from Google Analytics API, custom event tracking and heatmaps.
Data Engineer & AI Developer
Technologies


What I Built
Multi-source data pipeline
Integration with Google Analytics 4 API, custom event tracking (clicks, scroll depth, time on section) and contact forms. Python ETL pipeline aggregating data in PostgreSQL with automatic cleaning and normalization.
AI-driven segmentation & patterns
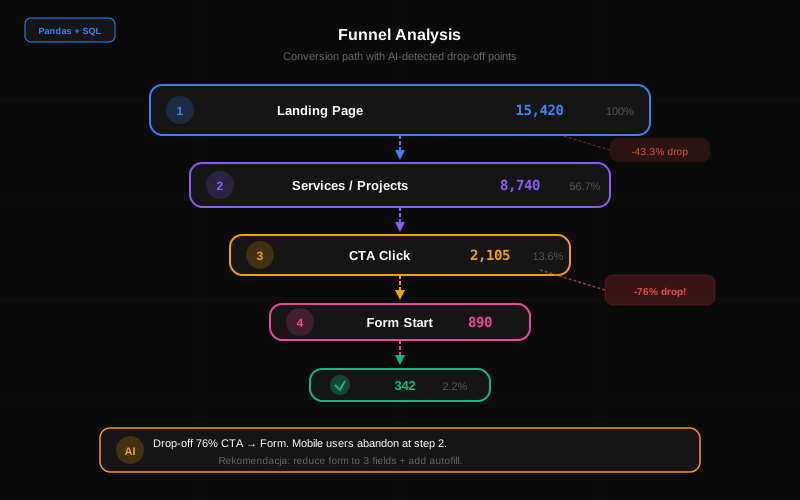
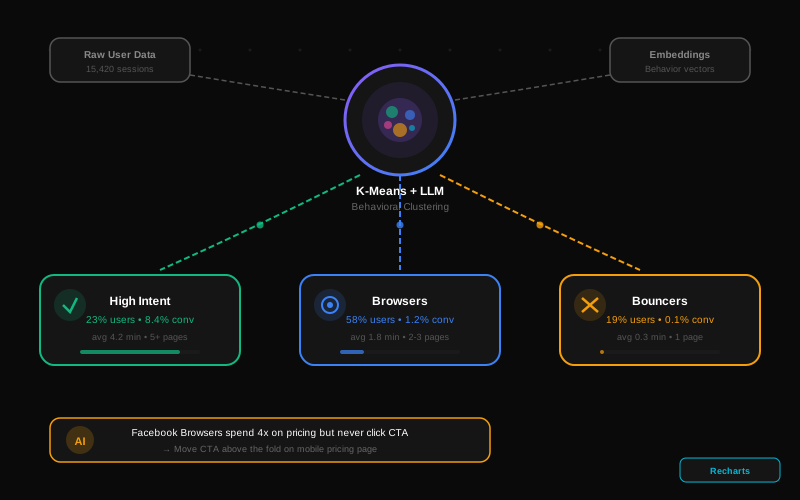
User clustering based on behavior (k-means + LLM embeddings). AI agent analyzes conversion paths, identifies drop-off points and generates hypotheses in natural language: 'Mobile users abandon form at step 2 — too many fields.'
Dashboard with recommendations
Interactive Next.js dashboard with Recharts visualizations. Funnel analysis, click heatmaps, user segments. Key feature: AI recommendations panel — specific change suggestions with projected conversion impact.
Challenge
Clients had Google Analytics but didn't know what to do with the data. Raw metrics (bounce rate, session duration) don't tell you WHAT to change. They needed a tool that turns data into specific, actionable recommendations.
Solution
Pipeline combining behavioral data from multiple sources, AI for pattern analysis and natural language recommendations. LangChain agent gets site context (industry, goals, funnel) and analyzes anomalies, trends and segments — outputting specific change suggestions.
Key Decisions
Python + Pandas for ETL instead of dedicated tool (flexibility)
LangChain agent with database access — dynamic SQL queries
Recharts over D3 — faster development with sufficient customization
PostgreSQL with materialized views for fast aggregations
The best part is when the agent says 'Facebook users spend 4x more time on the pricing page but never click the CTA — the button is below the fold on mobile'. Three sentences, and the client knows exactly what to change. That's the value of AI — not dashboards with 50 charts, but answering the question 'what should I do?'
Kacper Kawczak
Data Engineer & AI Developer
Results
Clients implementing recommendations saw an average 23% conversion increase within the first month. Analysis time reduced from 2 days of manual analyst work to 15 minutes of automated reporting. Identified UX issues that were missed during manual data review.